Published on December 15, 2020

Just before 7:00 on a cool, misty Seattle morning, Jacqueline Peltier stands alone on the University of Washington campus. Nearby, squirrels and rabbits frolic in the morning dew. Peltier, part of a National Science Foundation-funded research team, will spend the next hour securing a 360-degree camera to the roof of a rental Toyota Prius Prime, ensuring it’s level and synced with its smartphone controller. In the past, this setup traveled to Puerto Rico, capturing the aftermath of Hurricane Maria. Today, Peltier is crisscrossing Seattle on a 100-mile route to document a different emergency: the COVID-19 pandemic.
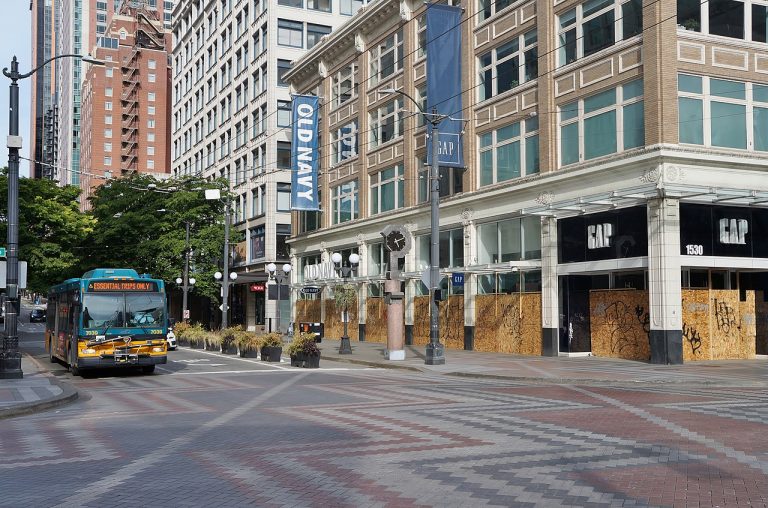
The idea arose in the first days of COVID-19’s spread across Seattle. Joe Wartman, Peltier’s colleague, an environmental engineer who studies natural disasters, was walking home from work one day when he noticed the empty streets, abandoned businesses and quiet sidewalks. “It struck me how much Seattle looks like a disaster zone,” he said.
Unlike earthquakes or hurricanes, however, the pandemic has been raging for months. Since March, public health recommendations have tightened and loosened, businesses have closed and reopened, and travel has ebbed and flowed. Peltier and Wartman, along with a team of public health researchers and engineers, are capturing how COVID policies and the behavior of Seattle residents have changed the look and feel of the city. “We haven’t had a pandemic at this scale in modern history,” said study co-investigator Nicole Errett, an assistant professor of environmental and occupational health at the UW School of Public Health. “This data provides the novel opportunity to really see, as we change policy, what happens in the short term.”
Peltier has retraced the same path through Seattle roughly every three weeks. The route was carefully mapped out using neighborhood census data to examine how socioeconomic status influences business recovery and neighborhood activity. “We really want to understand what role this pandemic is going to play in either bringing us closer together economically, or pushing us further apart,” said Wartman.
Continue reading at High Country News.
Originally written by Jane C. Hu for High Country News.