Published on May 21, 2020

It’s not a surprise that traffic, like many things, has been impacted by COVID-19. But by how much? Researchers in UW CEE’s STAR Lab now have an answer to that question after employing a new scoring algorithm they developed to measure fluctuations in traffic.
“We felt a strong need and thus started to develop an online tool to quantify traffic performance on our roads multiple months ago,” says professor Yinhai Wang, director of PacTrans and the STAR Lab. “Our purpose was to learn from our road sensor data and predict how traffic would perform on a future day given the weather forecast and scheduled big events like a Seahawks game.”
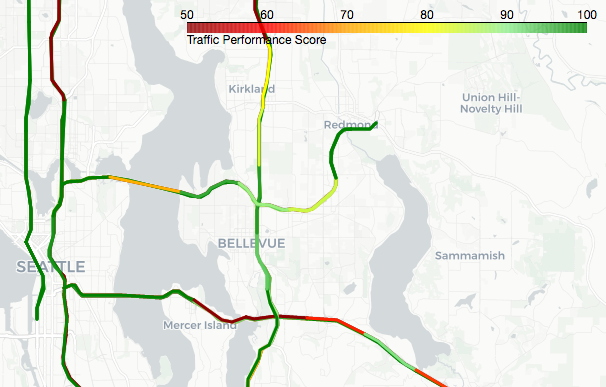
The researchers devised a metric called the Traffic Performance Score (TPS), which they applied to the greater Seattle area freeway network, the results of which they share on their web site. A perfect score of 100% means that roadway users can travel at free-flow speed without encountering any traffic slowing or congestion.
“This tool can answer important questions such as how traffic performance changes during a day, impacts of COVID-19 on local traffic, traffic performance differences before and after the UW moved all courses online, vehicle miles of travel (VMT) reduction by the Stay Home, Stay Healthy order, and more,” says Wang.
Continue reading at UW Civil and Environmental Engineering News.
Originally written by Brooke Fisher for UW CEE.